Crude Oil
Friday 23 May, 2025
Short term - Technical Outlook
Crude Oil is currently trading in a broken ascending channel on the 30-minute chart. In the last session, it closed at 5,265, down by 30 points. Holding above the resistance near the 5,440 range could lead to further upside, while immediate support is placed at 5,200.Further intraday upside momentum is likely above 5,285, while a breakdown below 5,200 could trigger additional selling pressure.
Short term Research Report Call
Buy Above: 55,100 | Targets: 55,280, 55,500, 55,750 | Stop-loss: 54,800
Sell Below: 54,800 | Targets: 54,620, 54,200, 53,800 | Stop-loss: 55,000
Short term Chart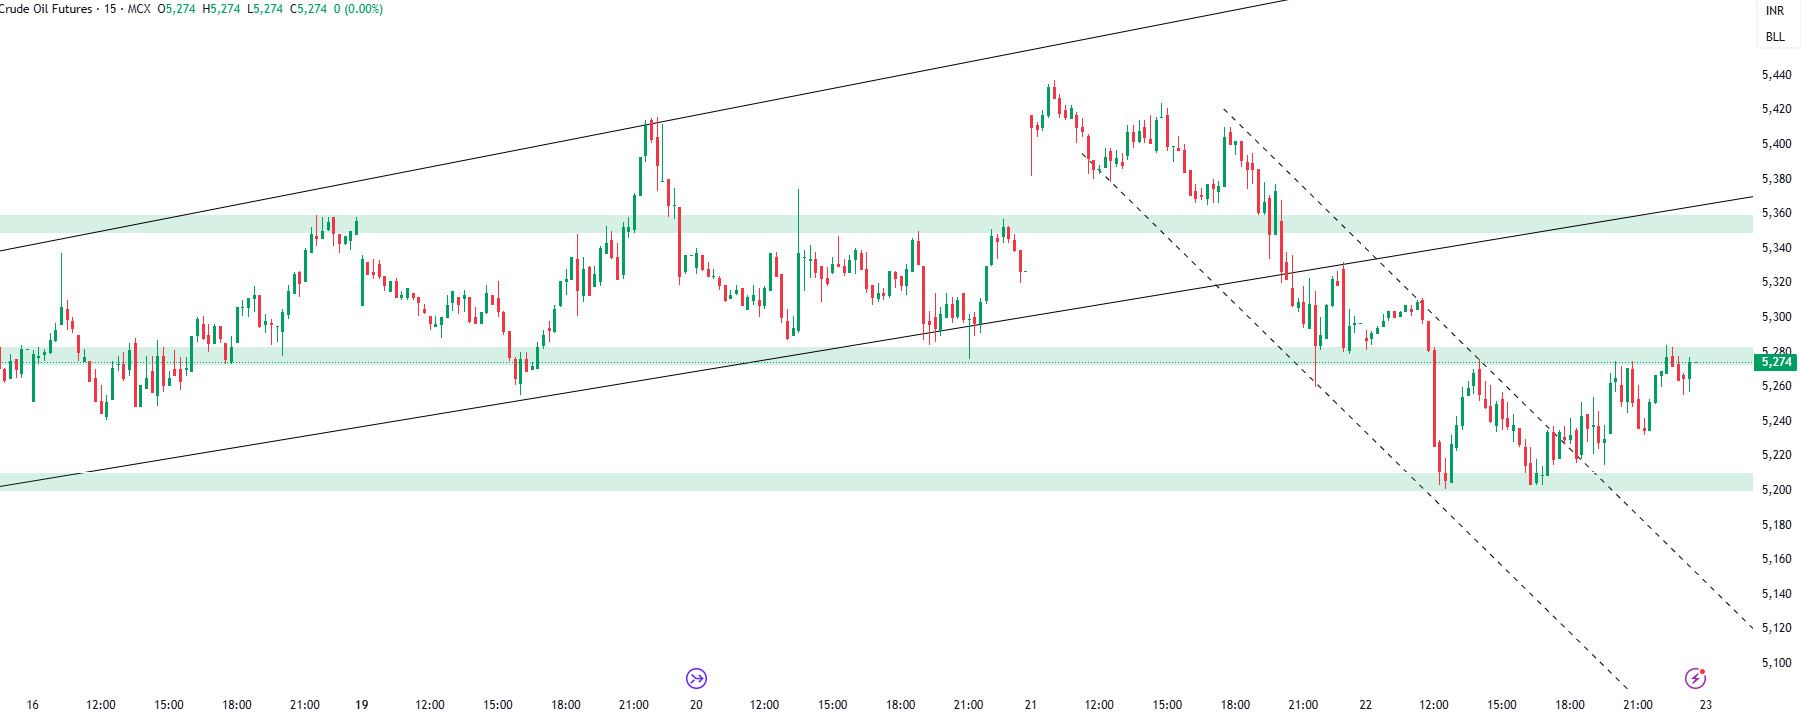
Validity
18/06/2025
Pivot
5259.00
Buy Above
5276.60
R1
5300.80
R2
5326.10
R3
5371.20
Stop Loss
5270.00
Pivot
5259.00
(All values are in INR)
Sell Below
5241.40
S1
5217.20
S2
5191.90
S3
5146.80
Stop Loss
5270.00
Gold
Friday 23 May, 2025
Short term - Technical Outlook
In the last session, Gold closed at 95536, in a slight negative.Gold is trading in an ascending channel in the wider time frame and in a descending channel in the shorter time frame, as shown in the chart. The descending channel resistance is placed in the 95,700–95,800 range, and the immediate support is placed at the 91,000 range. Gold needs to hold above the 96,500 range for a confirmed uptrend.For intraday traders, a move above 95,800 may indicate upside potential, while a dip below 95,200 could trigger further downside pressure.
Short term Research Report Call
Buy Above: 95,800 | Targets: 96,250, 96,600, 97,300 | Stop-loss: 95,300
Sell Below: 95,200 | Targets: 94,800, 94,400, 94,000 | Stop-loss: 95,700
Short term Chart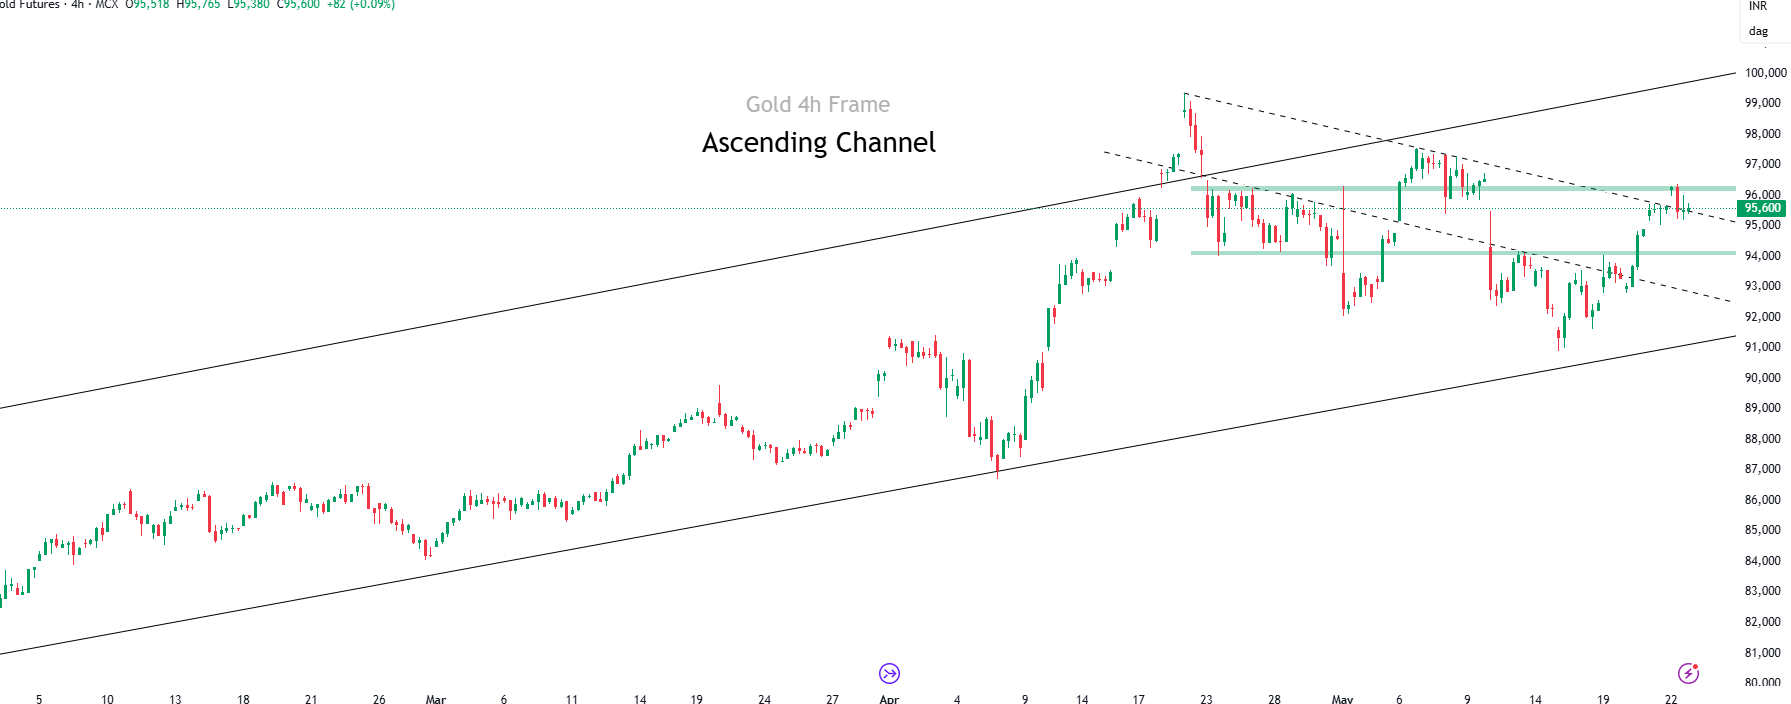
Validity
05/06/2025
Pivot
95706.67
Buy Above
95895.79
R1
96155.83
R2
96427.69
R3
96912.31
Stop Loss
95824.87
Pivot
95706.67
(All values are in INR)
Sell Below
95517.55
S1
95257.51
S2
94985.65
S3
94501.03
Stop Loss
95824.87
Natural Gas
Friday 23 May, 2025
Short term - Technical Outlook
Natural Gas is currently trading in a broken descending channel, as seen in the chart. It is facing resistance in the 294–295 range. The last session closed at 280.90 down by 9.5 points. Another intraday move is likely above 283 . However, a close below 278 could signal further downside in prices. Sustaining above 330 on a broader timeframe could lead to short-term bullishness in Natural Gas.
Short term Research Report Call
Buy Above: 283 Targets: 285,288,294 | Stop-loss: 280
Sell Below: 278.5| Targets: 276,273,266 | Stop-loss: 281
Short term Chart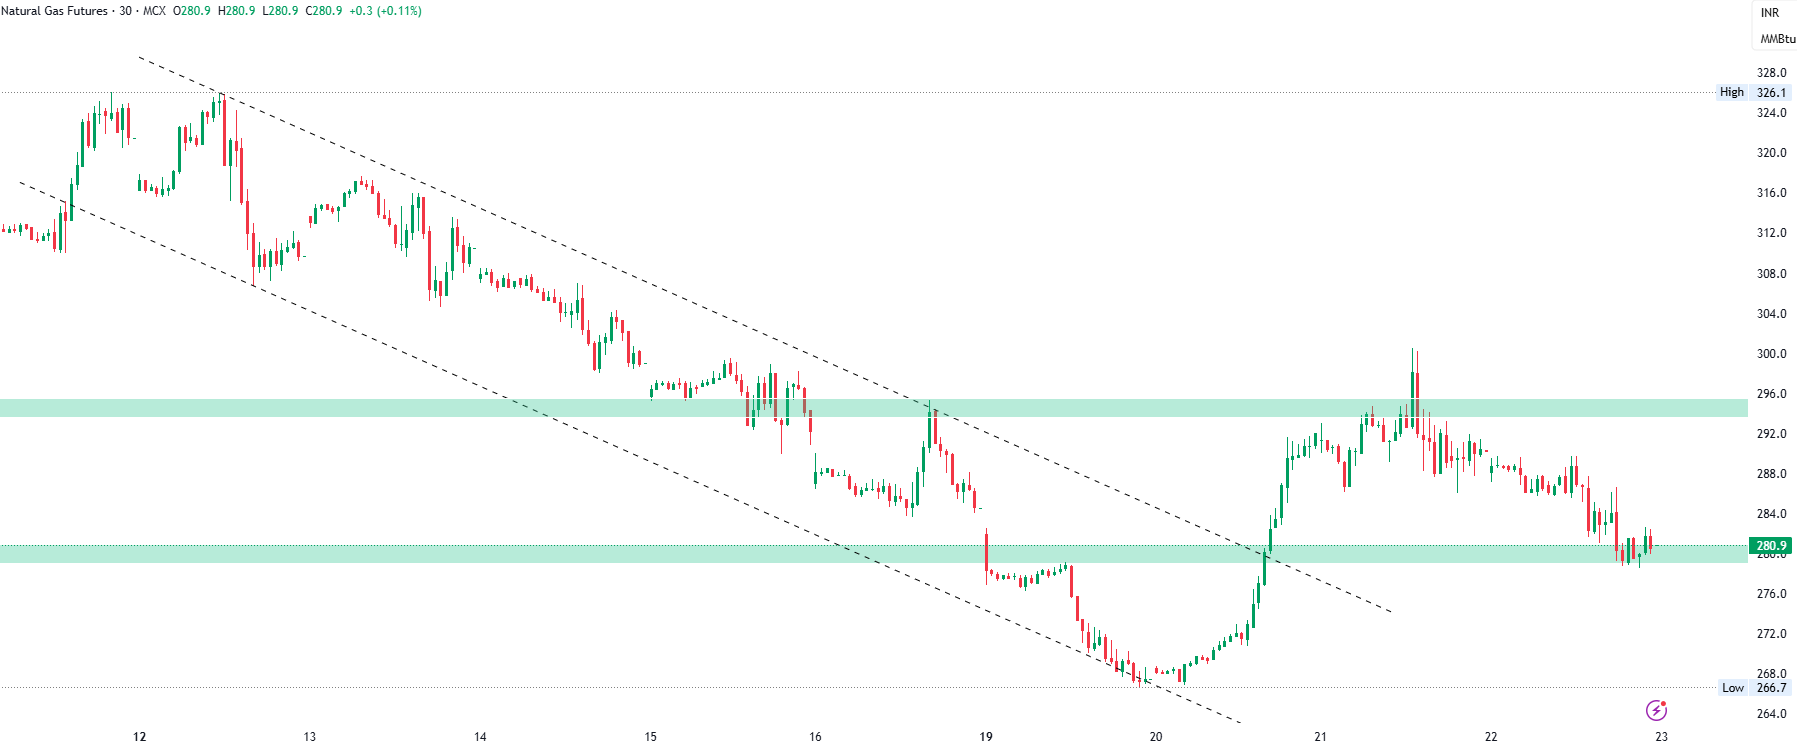
Validity
27/05/2025
Pivot
283.13
Buy Above
284.94
R1
287.43
R2
290.03
R3
294.66
Stop Loss
284.26
Pivot
283.13
(All values are in INR)
Sell Below
281.33
S1
278.84
S2
276.24
S3
271.61
Stop Loss
284.26
Note: Above information is not recommending any buy or sell position, this is for your reference only and trading or investment in commodities & derivatives is subject to market risk.
Disclaimer: Investment in securities/commodities market subject to market risk, read all the related documents carefully before investing/trading.
Analyst Certification: I/We, Ayushi Jain Research Analyst, authors, and the name subscribed to this report, hereby certify that all the views expressed in this research report accurately reflect our views about the subject issuer(s) or securities. We also certify that no part of our compensation was, is, or will be directly or indirectly related to the specific recommendation(s) or view(s) in this report. NISM Research Analyst registration number – NISM-201900015194.
