NIFTY 50
As on 23 May, 2025 04:14pm.
Loading...
0.00 (0.00%)
*As mandated by Exchange & other statutory authorities, the data feeds are delayed by 15 mins.
Range
Daily
52 Weeks
Daily Low
Daily High
0.00
0.00
Open
0.00
Prev.Close
0.00
Volume
0
Gift Nifty is trading at 24680.00, up by 25.00 points, indicating a gap-down opening for Nifty
Rupee Desk - USD/INR: Currently trading at 85.23
Short term - Technical Outlook
The Indian stock market is set to open on a flat to positive note. GIFT Nifty is trading at 24,680 up by 25 points, indicating a likely slight gap up opening for the Indian market. Meanwhile, the US and Asian markets are trading on a mixed note, while the European market is trading in the red.
Global cues remain cautious as investors assess the impact of the US tax bill, which may add $3.8 trillion to debt over the next decade. US bond yields saw some cooling, while Asian markets gained modestly on Japan’s positive inflation data. Oil prices extended losses amid expectations of higher OPEC+ output, and Bitcoin’s recent rally improved overall risk sentiment.
Nifty is currently facing resistance in the 25,050–25,070 range. A breakout above this level could lead Nifty toward the 25,350–25,600 zone. Nifty is currently moving within an ascending channel. In the last session, Nifty closed at 24,609, down by 203 points. An intraday move above 24,660 could signal further upside momentum. Conversely, a fall below 24,500 could invite weakness and profit-booking. Holding above 25,000 remains crucial for maintaining bullish sentiment. Investors can consider a buy-on-dip strategy.
FIIs were net sellers, sold 5045 crore, while DIIs were also net buyers to the tune of 3715 crore. However, sustained institutional activity and improved global cues may continue to boost overall investor confidence.
Short term Research Report Call
Buy Above: 24,660 | Targets: 24700, 24760, 24830 | Stop-loss: 24,600
Sell Below: 24,500 | Targets: 24400, 24340, 23290 | Stop-loss: 24,560
Short term Chart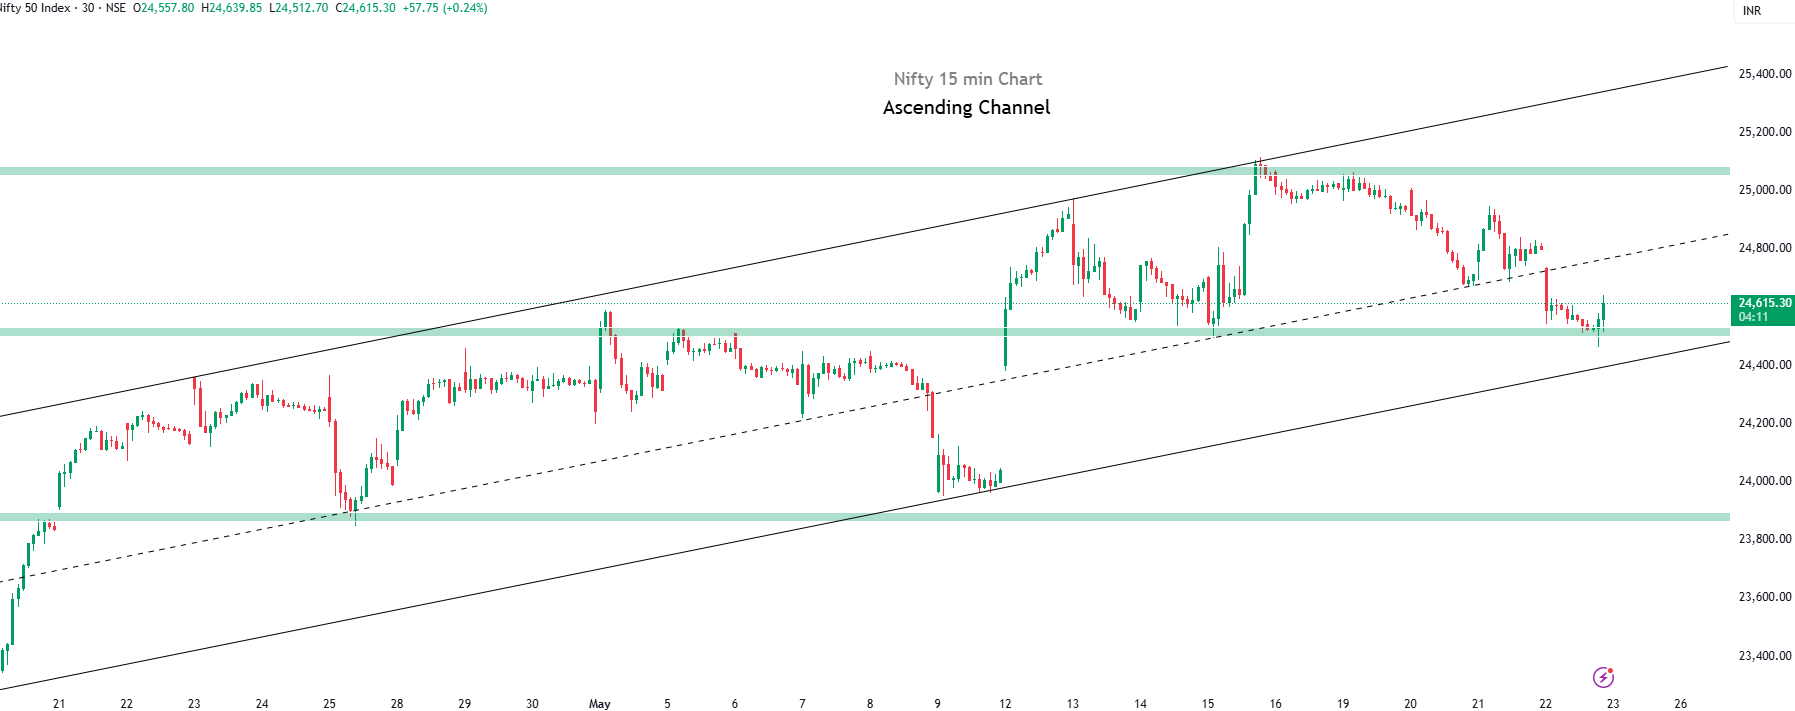
Long term - Technical Outlook
Nifty is currently trading within a broken descending channel on the 4-hour chart. If it sustains above the 24,500 level, momentum is expected to build toward the 24,800 range, while a breakdown below 23,900 may trigger additional downside pressure.
Investors and short-term traders can consider a buy-on-dips strategy for the long term, as the market is currently trading at attractive valuations. Quality investments at these levels are likely to yield strong long-term returns.
Long term Research Report Call
Buy Above: 24,500 | Targets: 24,800, 25,150, 25,500 | Stop-loss: 24,200
Sell Below: 23,900 | Targets: 23,500, 23,350, 23,000 | Stop-loss: 24,100
Long term Chart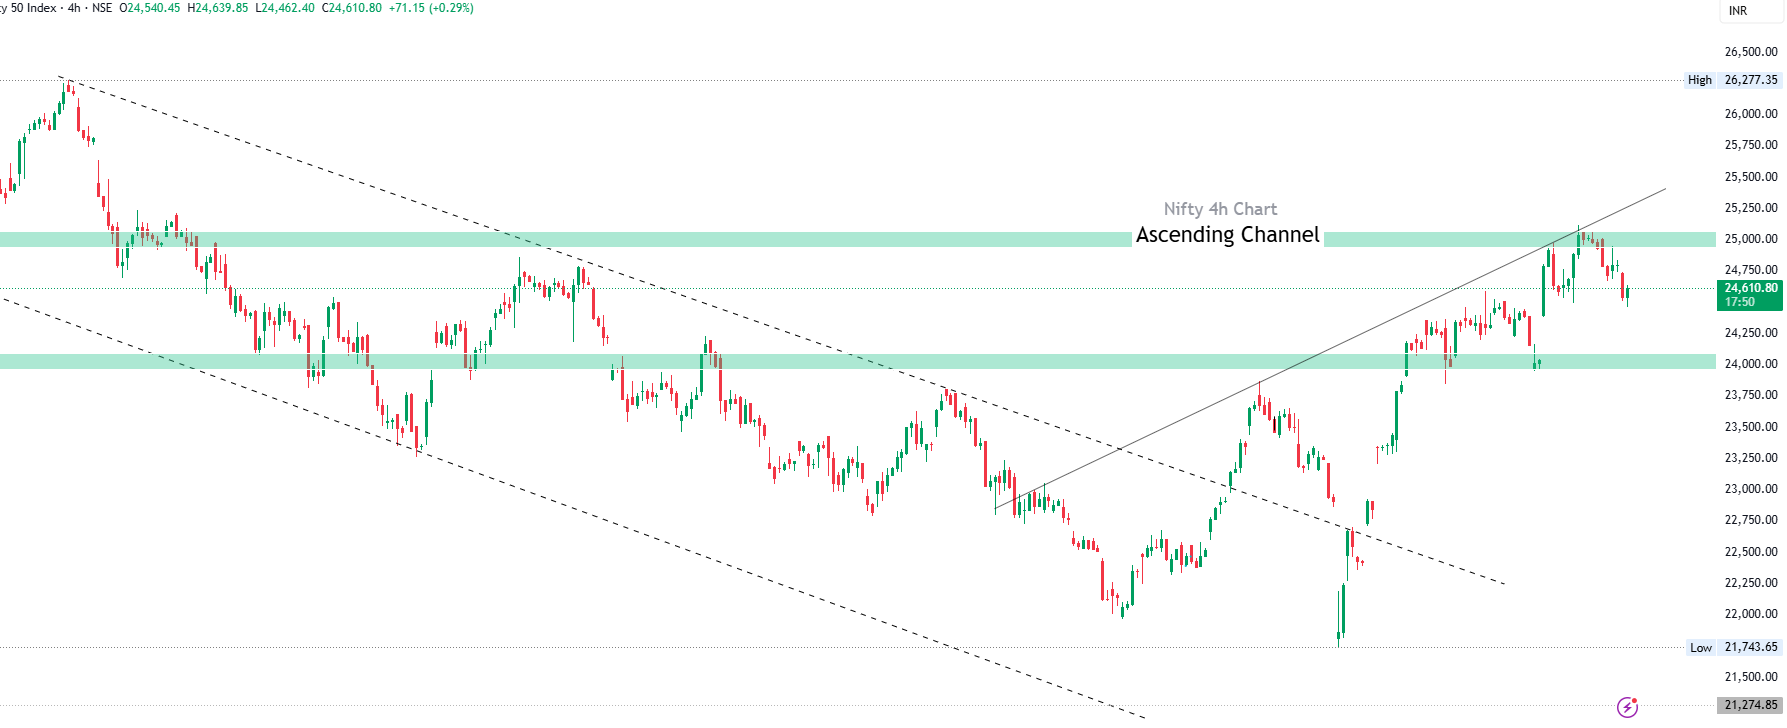
Market View
May 20th 2025
Market View
Resistance 25,000

Support 24,800
FII & DII Activities
Particular
FIIs
DIIs
Net Purchase/ Sales (Cr)
16 May 2025
-525.95
-237.93
MTD-May (Cr)
May
+23,256.6
+23,060.62
The Indian stock market opened slightly higher on Tuesday, May 20, supported by gains in IT and metal stocks amid positive global cues. At 9:24 AM, the BSE Sensex was up 136.39 points or 0.17% at 82,195.81, while the NSE Nifty50 rose 30.30 points or 0.12% to 24,975.75. However, broader markets saw profit booking after a six-day rally, with the Nifty Midcap 100 down 0.22% and the Nifty Smallcap 100 slipping 0.19%.
Asian markets traded higher, taking cues from overnight US gains and fresh liquidity from China. Japan’s Nikkei rose 0.37%, Hang Seng 1.34%, KOSPI 0.27%, and Shanghai Composite 0.36%. In the US, major indices ended in green despite debt rating concerns — the Dow gained 0.32%, S\&P 500 rose 0.09%, and Nasdaq added 0.02%.
Market breadth on the NSE was weak, with 1,236 stocks declining and 1,104 advancing out of 2,412 traded. India VIX dipped 0.34% to 17.30. Tata Steel led the Nifty50 gainers with a 2.02% rise, followed by JSW Steel, Infosys, ITC, and Tech Mahindra. On the losing side were Shriram Finance, Eicher Motors, HDFC Bank, Jio Financial Services, and Power Grid. Among sectors, Nifty IT rose 1.08%, Metal 0.86%, and FMCG 0.24%, while Realty, Media, and Private Bank indices traded in the red.
Global Market
May 23rd 2025
NASDAQ
USA
18,872.64
-270.07 -1.41
23rd May
Dow Jones
USA
41,945.72
86.63 0.21
23rd May
FTSE
UK
8,739.26
-47.2 -0.54
22nd May
DAX
GERMAN
23,999.17
-123.23 -0.51
22nd May
GIFT Nifty
Singapore
24,681.5
26.5 0.11
23rd May
NIKKEI 225
Japan
37,256.98
271.11 0.73
23rd May
Shanghai
China
3,382.26
2.07 0.06
23rd May
S&P 500
USA
5,842.01
-2.6 -0.04
23rd May
Market at Closing
March 20th 2025
Top Gainers
| BHARTIARTL | 1,704 66.85 4.08 |
| TITAN | 3,183.05 106.75 3.47 |
| EICHERMOT | 5,234 133.1 2.61 |
| BAJAJ-AUTO | 7,920 198.15 2.57 |
Top Losers
| INDUSINDBK | 685 -7.7 -1.11 |
| BAJFINANCE | 8,680 -51.6 -0.59 |
| TRENT | 5,215 -15.85 -0.3 |
| SHRIRAMFIN | 666.3 -1.65 -0.25 |
Technicals
Pivot Advanced Levels
Check live levels for all scripts
Buy Above
24839.28
R1
24904.18
R2
24972.03
R3
25092.98
Stop Loss
24762.58
Pivot
24792.08
(All values are in INR)
Sell Below
24744.88
S1
24679.98
S2
24612.13
S3
24491.18
Stop Loss
24821.58
Pivot Basic Levels
| R4 | R3 | R2 | R1 | Pivot | S1 | S2 | S3 | S4 | |
| Classic | 25443.15 | 25265.12 | 25087.08 | 24970.12 | 24792.08 | 24675.12 | 24497.08 | 24380.12 | 24263.15 |
| Woodie | 25692.35 | 25295.65 | 25102.35 | 25000.65 | 24807.35 | 24705.65 | 24512.35 | 24410.65 | 23922.35 |
| Camarilla | 25015.40 | 24934.28 | 24907.23 | 24880.19 | 24792.08 | 24826.11 | 24799.07 | 24772.03 | 24690.90 |
Moving Averages
Bullish
Bearish
EMA
SMA
5 Day
20771.05
10 Day
19854.03
20 Day
19157.54
50 Day
18527.20
100 Day
18186.68
200 Day
17872.16
Momentum Oscillators
Stoch RSI
71.12
ROC
2.39
Ultimate
53.40
Williams
-22.29
CCI
58.98
Stochastic
70.84
RSI
67.12
Bullish
1
Bearish
0
Neutral
6
Trend Oscillators & Volatility
ATR
130.06
Low Volatility
MACD
384.70
Bullish
Bullish
1
Bearish
0
Neutral
0
Nifty Stock List
Check all stocks
| Stock Name | CMP | Change (%) | Market Cap (Cr.) | Sector | Piotroski Score |
| RELIANCE | 1426.8 | 1.2346 | 1930339.5 | Oil & Gas | 7 / 9 |
| HDFCBANK | 1933.6 | 0.7136 | 1480723.42 | Banks | 3 / 9 |
| HDFCBANK | 604.5 | 1.0616 | 1480723.42 | Banks | 3 / 9 |
| TCS | 3514.6 | 1.0814 | 1271396 | Software & IT Services | 7 / 9 |
| BHARTIARTL | 1831.7 | 0.0164 | 1116553.71 | Telecom | 8 / 9 |
Disclaimer: Investment in securities/commodities market subject to market risk, read all the related documents carefully before investing/trading.
Analyst Certification: I/We, Ayushi Jain Research Analyst, authors, and the name subscribed to this report, hereby certify that all the views expressed in this research report accurately reflect our views about the subject issuer(s) or securities. We also certify that no part of our compensation was, is, or will be directly or indirectly related to the specific recommendation(s) or view(s) in this report. NISM Research Analyst registration number – NISM-201900015194.
Frequenlty asked questions
Can I trade NIFTY50?
How are stocks selected to be a part of Nifty 50?
How does the closing price of NIFTY50 determined?
What are Nifty Futures and Options?
